Human beings vary psychologically in complex ways. Any attempt by designers to classify people into groups merely results in a statement of broad principles that may or may not be relevant to the individual. Design permeates every aspect of human experience and data pertaining to what cannot be seen such as touch, taste, and smell are often expressions of opinion rather than checkable fact.
The analysis of the human information processing system requires a designer to critically analyse a range of causes and effects to identify where a potential breakdown could occur and the effect it may have.
Psychological Factor Data
Term: Human factor data related to psychological interpretations caused by light, smell, sound, taste, temperature and texture.
- These factors can better help understand and optimise the user’s safety, health, comfort and performance.
- These are a significant part of ergonomics and human efficiency, comfort and safety can be affected by these factors.
Methods of Collecting Psychological Factor Data
Data Collection through 4 types of measurement data scales, which include; nominal, ordinal, interval and ratio.
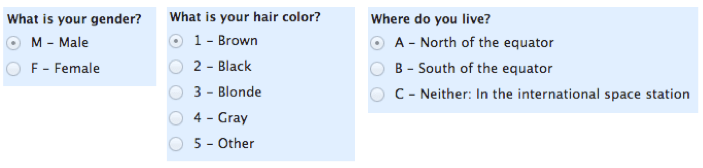
Term: Nominal (Data) Scale – Nominal means ‘by name’ and used in classification or division of objects into discrete groups. Each of which is identified with a name e.g. category of cars, and the scale does not provide any measurement within or between categories.
|
 |
Term: Ordinal (Data) Scale – A statistical data type that exists on an arbitrary numerical scale where the exact numerical value has no significance other than to rank a set of data points. Deals with the order or position of items such as words, letters, symbols or numbers arranged in a hierarchical order. Quantitative assessment cannot be made.
|
 |
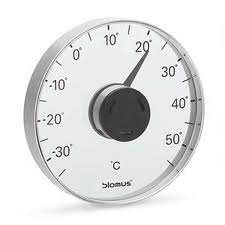
Term: Interval (Data) Scale – Interval data are based on numeric scales in which we know the order and the exact difference between the values. Organised into even divisions or intervals, and intervals are of equal size.
|
 |
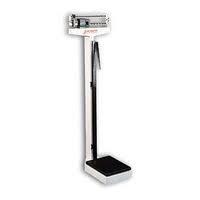
Term: Ratio (Data) Scale – A ratio scale allows you to compare differences between numbers. For example, use a rating scale of 1-10 to evaluate user responses.
|
 |
| This website is very useful. |
Qualitative versus Quantitative Data
Term: Qualitative Data – Typically descriptive data used to find out in depth the way people think or feel – their perception. Useful for research at the individual or small (focus) group level.
- Nominal or Ordinal Scale (Qualitative) – taste, smell, temperature and texture.
- Qualitative data may be used in a design context relating to psychological factors, but individuals vary in their reaction to the data.
- For example, one person will find a room temperature comfortable while another person will find it uncomfortable, though the temperature is constant.
Term: Quantitative Data – Data that can be measured and recorded using numbers. Examples include height, shoe size, and fingernail length.
- Interval or Ratio Scale (Quantitative) – sound, temperature and light
Human Information Processing Systems
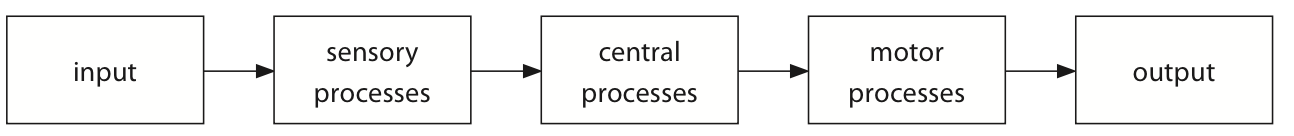
Term: Human information processing system – An automatic system that a person uses to interpret information and react. It is normally comprised of inputs, processes (which can be sensory, central and motor), and outputs.
- Can be represented using a flow chart.
- Below is a flow diagram; the arrows represent the flow of information through the system.
- The boxes represent functional elements in the processing chain, where information is processed.
Scenario 1: Where we can apply the human information processing system to a common task, such as a finger in hot water.

Scenario 2: when using a mobile phone to make a telephone call.
- The input would be the number to be called.
- The sensory processes would be the eyes, which would transmit information to the brain.
- The brain is the central processing unit, which examines the information and selects a response coded as a series of nerve impulses transmitted to the hand and muscles.
- These are the motor processes, which reconvert the instructions into actions, that is, outputs.
Activity:
You are driving a car and you see a red traffic light up ahead. Develop a flow chart that represents the human information processing system that would occur.
A Breakdown in the Human Information Processing System (Effects and Reasons)
What happens if the information processing system breaks down?
In the car activity above you would have (hopefully) concluded that the output would be the foot pressing the brake so the car will stop. If there is a break down in the human information processing system then a car crash is a likely event.
- Here the few things could have occurred such as,
- Slow reaction time (between seeing the red light and reacting). Stimulus/input as not seen (Red light or car/pedestrian in the intersection). Response/output was not done/slipped/foot got caught, etc.
- In other words,
- The information inputs may be incompatible with the sensory receptors.
- At the central processing stage, the incoming information may be incorrect or no suitable responses to it are available.
- The motor output stage may be unable to perform the actions specified by the central processing unit.
Some reasons include:
- Age – too young and maybe have not learnt the skills (long term memory), too old maybe forget what to do, or too weak to carry out the task.
- Strength – too weak to carry out the task
- Skills – do not have the necessary skills yet, may have forgotten he skills, skills needed are too complex
- Health – when mental or physical health is comprised which may lead to not carrying out the necessary tasks.
- Environmental factors – see below for more details.
Effect of Environmental Factors
Term: Environmental factors – A set of psychological factors that can affect the performance of an individual that come from the environment that the individual is situated.
- Environmental factors include, sound, temperature, lighting, air quality (pollutants) and smell.
- Environmental factors can affect different individuals in different ways. Individuals react differently to sensory stimuli.
- Efficiency and comfort are affected by such factors.
- It becomes important to optimize environmental factors to maximize workplace performance.
- This can be challenging as user responses to environmental factors are different, some people will find 22C perfect while for others it may too cold! … though the temperature is constant.
Perception: The way in which something is regarded, understood or interpreted.
- The users respond differently to different environmental factors.
- Perception has an impact on the accuracy and reliability of psychological factors data
- Quantitative data may be used in a design context relating to psychological factors, but individuals vary in their reaction to the data.
- For example, one person will find a room temperature comfortable while another person will find it uncomfortable,
- How warm or cold work environments can affect the performance of an individual.
- Thermal comfort describes a person’s psychological state of mind and involves a range of environmental factors: air temperature, the heat radiating from the Sun, fires and other heat sources, air velocity (still air makes people feel stuffy, moving air increases heat loss), humidity, and personal factors (clothing and metabolic rate).
- Hopefully in an office environment where a number of people work together, the thermal environment satisfies the majority of the people.
- Thermal comfort is not measured by air temperature (quantitative), but by the number of people complaining (qualitative) of thermal discomfort.
Activity:
- The above temperature example can guide you for this activity.
- Show how users respond differently to each of the following, sound, lighting, air quality and smell.
- Put your answers on the class Padlet.
Alertness
Alertness: The level of vigilance, readiness or caution of an individual.
Environmental factors induce different levels of alertness.
- Temperature: too warm and you get sleepy and less alert – too cold and you become more alert. Next time you are on a long haul flight note the temperature fluctuations while flying.
- Sound: too loud which can be distracting or even cause harm, high pitched or repetitive on/off noises also become distracting.
- Lighting: too dim hard to see things need to get close or strains the eyes, natural versus fluorescent (can affect peoples eyes)
- Air quality: excess dust or other pollutants could cause people to find it hard to breathe, maybe cough, etc. Certain essential or aroma oils are said to improve alertness
- Smell – bad smells (whew) will draw ones attention away as opposed to the smell of a hot apple pie.
International Mindedness
The origin of psychology (as a mainly western academic subject) along with recent neurological insights on a global scale need to be taken into account in applying any psychological factors to global design problems.
Theory of Knowledge
How might the collection and interpretation of data be affected by the limitations of our sense perception?
Something Extra …
Outline psychological human factors data that could be used in the design of a mobile phone.:
For example, texture, sound, colour and light.
Explain the relevance of using the different rating scales to design contexts.
For example, a comfort rating scale of 1–10 is an ordinal scale.
Sample exam questions
Describe the human information- processing system.
Apply the information flow diagram to particular contexts.
For example, a car driver processes information from the road and the car, and produces various control responses such as braking or changing gear.
Outline the factors that contribute to thermal comfort in office and other working environments.
Outline how motor outputs may be inhibited if the physical fit between the person and the environment is wrong.
Identify the general human factors contributing to accidents.: Categories of factors that cause accidents include management (policies, safety education, decision centralization), physical environment (noise, temperature, pollutants, trip hazards, signage), equipment design (controls, visibility, hazards, warnings, guards), the work itself (boredom and repetitiveness, mental and physical workload, musculoskeletal impacts such as force, pressure and repetition), social and psychological environment (group norms, morale), and the worker (ability, alertness, age, fatigue).